 Genome Research (2000): geneid in Drosophila melanogaster
Geneid in Drosophila.
G. Parra, E. Blanco, and R. Guigó.
Genome Research 10(4):511-515 (2000).
| Contents |
In this site we describe all the data used used for geneid training.
- Data Set
- Positional Weight Matrices & Coding statistic
- geneid Predictions in Adh Region
- Example of geneid Annotation
| Data Set |
We used the set of 275 multi-exon genes and the set of 141 single-exon sequences provided by Martin Reese:
| multi_exon_GB.dat.gz |
| single_exon_GB.dat.gz |
We have randomly embedded the sequences in the MR-set in a background of artificial random intergenic DNA.
This new sequence of 5,689,209 bp was used to assess the accuracy of the predictions:
| Artificial sequence [fasta] |
| Artificial sequence CDS [gff] |
| Locus positions on Artificial sequence |
| Positional Weight Matrices & Coding statistic |
- Positional Weight Matrices:
- From the data set we obtain the following PWM :
Start site matrix
Donor site matrix
Acceptors site matrix
- From the data set we obtain the following PWM :
- Coding statistic:
- From the data set we obtain this matrices from Markov Model of order five :
Initial matrices
Transition matrices
- From the data set we obtain this matrices from Markov Model of order five :
- All this parameters are also in the param.default file, included in the last version of geneid (freely available).
| geneid Predictions in Adh Region |
Here you can download the predictions of the final version of geneid (v 3.0 EvoI) in gff format. For more information about how geneid works see the PAPER, submmited to Genome Research.
| Example of geneid annotation |
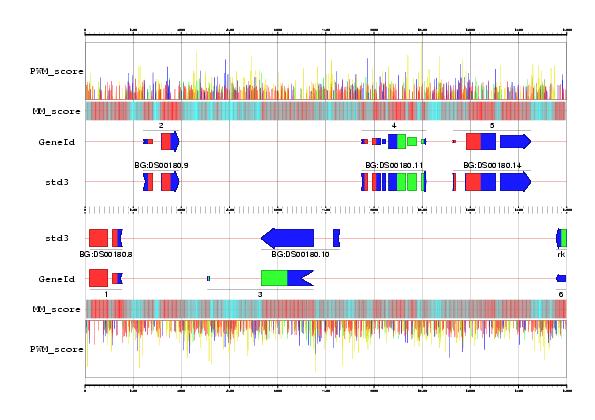
GeneId predictions obtained in the region 462500-477500 from the Adh sequence, compared with the annotation in the standard std3 set.
In a first step, GeneId identifies all possible donor (blue) and acceptor (yellow) sites, start codons (green) and stop codons (red) using Positions Weight Matrices (Sites file).
In the second step, GeneId builds all exons compatible with this site. Exons are scored as the sum of the scores of the defining sites, plus the score of their potential measured according with a Markov Model of order five.
In the figure, the coding potential is displayed along the DNA sequence, regions strong in red are more likely to be coding than region strong in blue (Markov vector file).
The final gene structure is generated maximizing the sum of the scores of the assembled exons.
The predicted exons for this sequence can be found (here) and the Std3 annotation for this region (here).
The figure has been obtained using the gff2ps program.

